Workplace injuries, accidents, and even fatalities are something every job site tries desperately to avoid. Across the world, measures are taken to provide a safe working environment for workers. However, despite active safety measures and enforcement from legal entities such as OSHA in the U.S., accidents do happen. Take a look our eye-opening list of construction safety statistics, along with general industry workplace safety statistics.
We give a comprehensive look at what is happening across the safety landscape both globally and in the United States. Our goal is to educate and build awareness around safety on the job site. Whether you are looking for construction safety statistics or general workplace safety statistics, this list has you covered.
We’ve compiled the largest list of safety statistics on the internet! 50 Shocking Statistics About Workplace and Construction Safety:

Construction Fatality Statistics
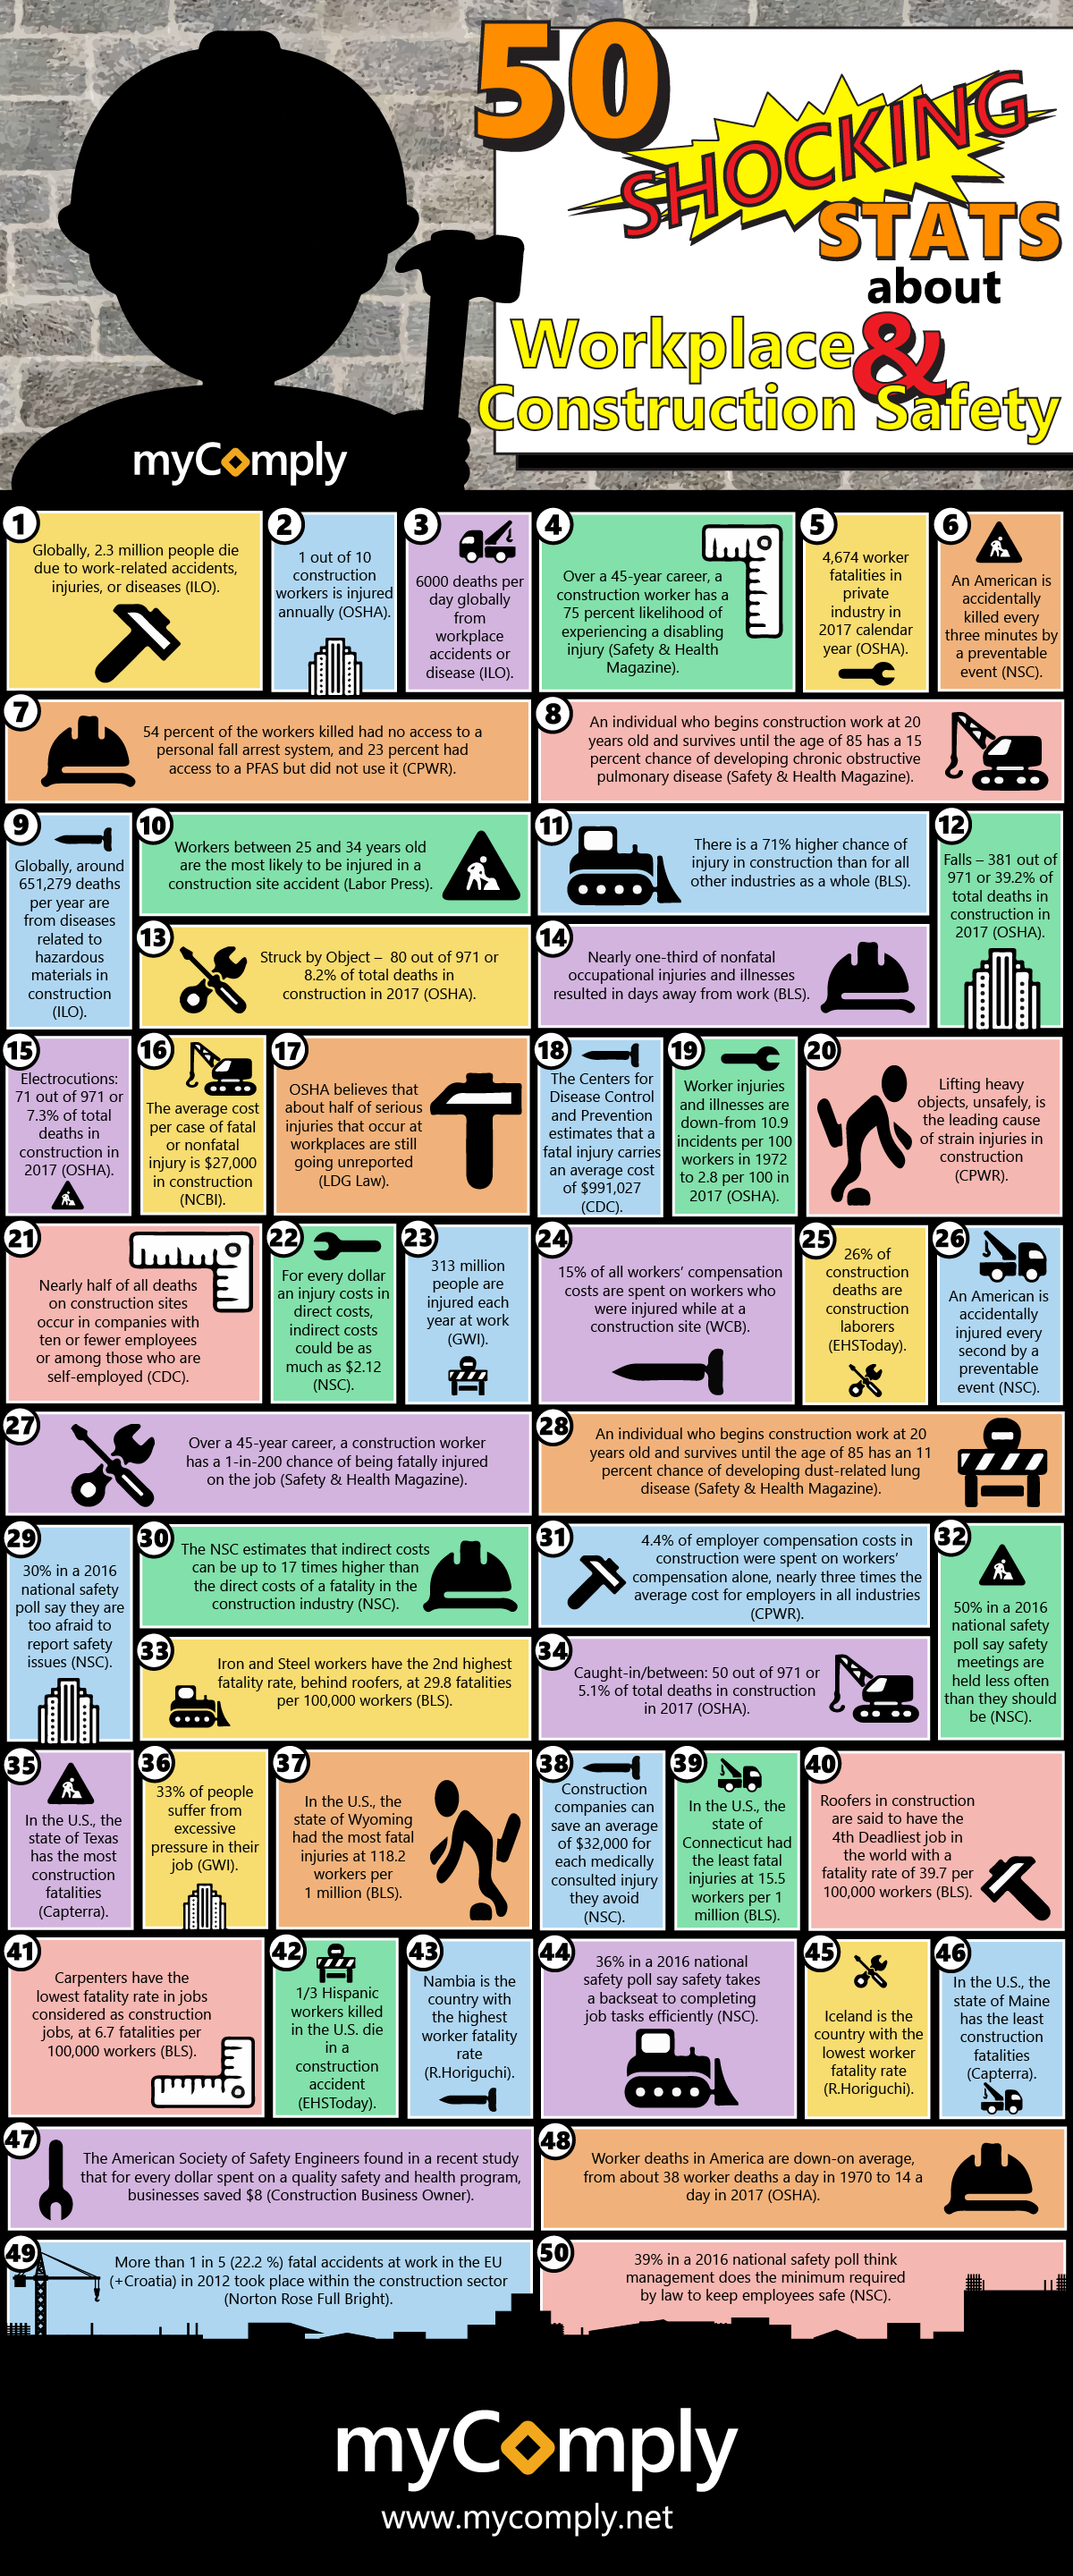
- 4,674 worker fatalities in the private construction industry for the calendar year of 2017 (OSHA).
- Falls – 381 out of 971 or 39.2% of total deaths in construction in 2017 (OSHA).
- Struck by Object – 80 out of 971 or 8.2% of total deaths in construction in 2017 (OSHA).
- Electrocutions: 71 out of 971 or 7.3% of total deaths in construction in 2017 (OSHA).
- Caught-in/between: 50 out of 971 or 5.1% of total deaths in construction in 2017 (OSHA).
- 54 percent of the workers killed had no access to a personal fall arrest system, and 23 percent had access to a PFAS but did not use it (CPWR).
- Over a 45-year career, a construction worker has a 1-in-200 chance of being fatally injured on the job (Safety & Health Magazine).
- Nearly half of all deaths on construction sites occur in companies with ten or fewer employees or among those who are self-employed (CDC).
- Roofers in construction are said to have the 4th Deadliest job in the world with a fatality rate of 39.7 per 100,000 workers (BLS).
- Iron and Steelworkers have the 2nd highest fatality rate, behind roofers, at 29.8 fatalities per 100,000 workers (BLS).
- Carpenters have the lowest fatality rate in jobs considered as construction jobs, at 6.7 fatalities per 100,000 workers (BLS).
- In the U.S., the state of Texas has the most construction fatalities (Capterra).
- In the U.S., the state of Maine has the least construction fatalities (Capterra).
General Workplace Fatality Statistics
- 2.3 million people die due to work-related accidents, injuries, or diseases (ILO).
- Globally, around 651,279 deaths/year are from diseases related to hazardous materials (ILO).
- 6000 deaths/day globally from workplace accidents or disease (ILO).
- Worker deaths in America are down on average, from about 38 worker deaths a day in 1970 to 14 a day in 2017 (OSHA).
- An American is accidentally killed every three minutes by a preventable event (NSC).
- In the U.S., the state of Wyoming had the most fatal injuries at 118.2 workers per 1 million (BLS).
- In the U.S., the state of Connecticut had the least fatal injuries at 15.5 workers per 1 million (BLS).
Construction Injury Statistics
- Over a 45-year career, a construction worker has a 75 percent likelihood of experiencing a disabling injury (Safety & Health Magazine).
- An individual who begins construction work at 20 years old and survives until the age of 85 has a 15 percent chance of developing chronic obstructive pulmonary disease (Safety & Health Magazine).
General Workplace Injury Statistics
- Worker injuries and illnesses are down-from 10.9 incidents per 100 workers in 1972 to 2.8 per 100 in 2017 (OSHA).
- Nearly one-third of nonfatal occupational injuries and illnesses resulted in days away from work (BLS).
- An American is accidentally injured every second by a preventable event (NSC).
- 33% of people suffer from excessive pressure in their job (GWI).
- Nambia is the country with the highest worker fatality rate (R.Horiguchi).
- Iceland is the country with the lowest worker fatality rate (R.Horiguchi).
- 313 million people are injured each year at work (GWI).
General Workplace Safety Statistics & Safe Practice Cost Savings
- The average cost per case of fatal or nonfatal injury is $27,000 in construction (NCBI).
- 15% of all workers’ compensation costs are spent on workers who were injured while at a construction site (WCB).
- OSHA believes that about half of serious injuries that occur at workplaces are still going unreported (LDG Law).
- 4.4% of employer compensation costs in construction were spent on workers’ compensation alone, nearly three times the average cost for employers in all industries (CPWR).
- The Centers for Disease Control and Prevention estimates that a fatal injury carries an average cost of $991,027 (CDC).
- The NSC estimates that indirect costs can be up to 17 times higher than the direct costs of a fatality in the construction industry (NSC).
- For every dollar an injury costs in direct costs, indirect costs could be as much as $2.12 (NSC).
- 50% in a 2016 national safety poll say safety meetings are held less often than they should be (NSC).
- 39% in a 2016 national safety poll think management does the minimum required by law to keep employees safe (NSC).
- 36% in a 2016 national safety poll say safety takes a backseat to completing job tasks efficiently (NSC).
- 30% in a 2016 national safety poll say they are too afraid to report safety issues (NSC).
- Construction companies can save an average of $32,000 for each medically consulted injury they avoid (NSC).
- The American Society of Safety Engineers found in a recent study that for every dollar spent on a quality safety and health program, businesses saved $8 (Construction Business Owner).
Workplace & Construction Safety Statistics: Comment and Share
After reviewing the list of workplace and construction safety stats, what do you think?
Some of the statistics we’ve compiled are pretty eye opening. Feel free to leave your input and your comments at the bottom of this post!
If you’re a safety manager or a construction safety coordinator who is reading the construction safety statistics, leave a comment and tell us what you do to promote safe practice on your job sites.
To download a high resolution PDF of the Infographic:
1. Click on the 50 Shocking Construction Safety Statistics Infographic.
2. Use the link to download a PDF version of the 50 Shocking Construction Safety Statistics Infographic.

It’s amazing that roofers have one of the top 5 deadliest jobs in the whole country. My brother is starting a new construction business and he wants to make sure everyone stays safe. I’ll share your article with him so that he understands how to keep people safe and why construction can be dangerous.
It’s really shocking to learn that the roofers in the US have the 4th deadliest job in the country. My brother is a new manager for a construction company and he is trying to change a few things. He needs to get heavy equipment on-site so he needs to make sure he has policies in place that will keep everyone safer.
Great info. We have been in the roofing business for a while…and I always stress how important safety is to our new hires…(and old) When you see the numbers…it is kind of crazy. Thank you for this information…you may have saved a few lives after the read it.
Shocking places to construct is really hard and dangerous, These poor people deserve to be treated better. some of them are probably paid badly too. let’s give them respect. thanks for sharing this amazing article.
Thank you very much for this beautiful article. This is really great 7 helpful. I appreciate your writing skills & thoughts. Thank for the strategy & the points. Great.
I was looking for an appropriate clarification for construction labor. I much appreciate, administrator, for sharing such awesome substance on this theme. Presently I have all I require about it. Here’s another enlightening substance for Construction labor: prices and features. you will get well-informed data about it here.
This is great but it would be even better if each statistic had a red or green up or down arrow to indicate the change from last year. For example work place deaths might have a green down arrow to show the numbers are down.
Good call, Corten! We’ll see what we can do in updating things.